Taking time off should be simple, but for many Americans, it rarely feels that way. There’s always another deadline, another expense, or another reason to put off the break a little longer.
That pressure shows up in the numbers: U.S. workers take fewer vacation days than their counterparts in other countries, younger employees report especially high levels of burnout, and more than one-third of adults aren’t getting enough sleep.
The ResortPass team looked at vacation habits around the world, burnout across generations, access to paid vacation in the U.S., and state-by-state sleep data to see how those pressures add up. Together, the findings paint a picture many people will recognize: Finding enough time to step away, recharge, and get proper rest can be surprisingly difficult.
Which countries get and take the most vacation time?
Receiving vacation days and actually using them are two different things. Expedia’s 2024 Vacation Deprivation Report offers a useful comparison of both across 11 surveyed markets.
Here’s the average number of vacation days per year offered by employers:
| France | 31 |
| Germany | 29 |
| United Kingdom | 27 |
| Hong Kong | 26 |
| Australia and New Zealand | 21 |
| Singapore | 20 |
| Canada and Japan | 19 |
| Mexico | 16 |
| United States | 12 |
But the average number of vacation days actually taken per employee is often lower than that:
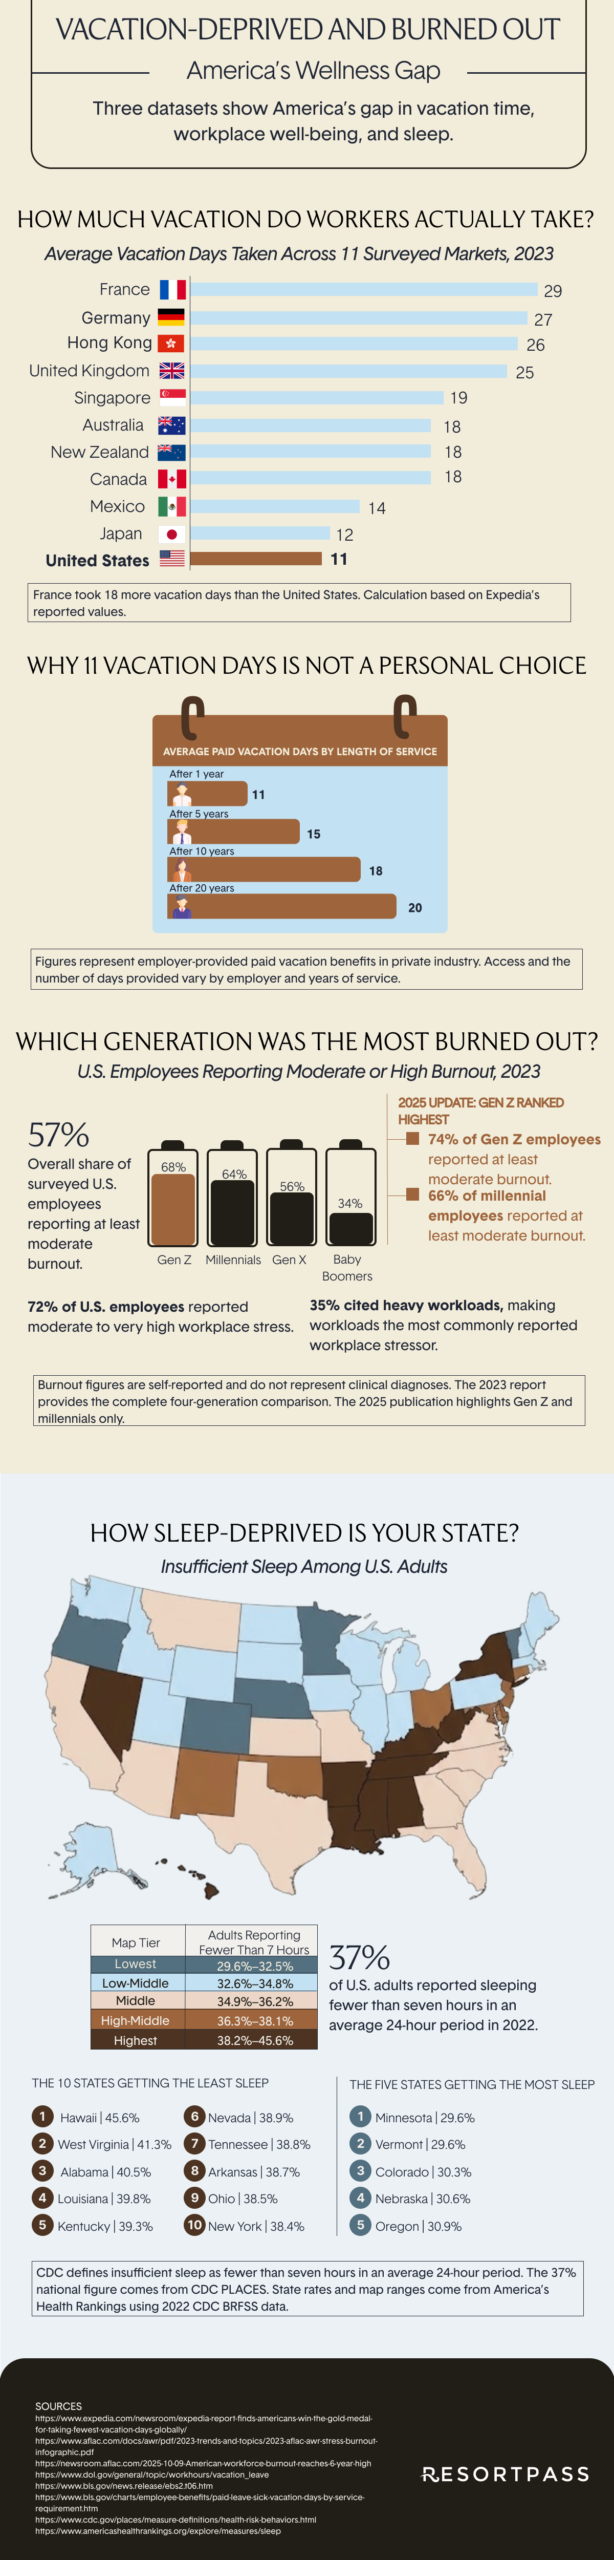
| France | 29 |
| Germany | 27 |
| Hong Kong | 26 |
| United Kingdom | 25 |
| Singapore | 19 |
| Australia, New Zealand, and Canada | 18 |
| Mexico | 14 |
| Japan | 12 |
| United States | 11 |
With so few days on offer, Americans often feel shortchanged. Expedia found that 65% of American respondents described themselves as vacation-deprived, and 32% said they sometimes went a year or longer between vacations, compared with 18% of respondents globally.
Paid vacation is not equally available to U.S. workers
Unlike some benefits that are mandated by federal labor law, the Fair Labor Standards Act does not require employers to provide paid vacation time. Vacation benefits are generally determined between employers and employees.
In March 2025, 80% of private-industry workers had access to paid vacation, leaving roughly one in five without it. Access also varied by job type and other worker characteristics.
For workers who do have paid vacation, tenure can make a sizable difference in how much time they get. Private-industry workers averaged 11 vacation days after one year of service, 15 after five years, 18 after 10 years, and 20 after 20 years.
Why are younger generations so burned out?
Burnout appears in every generation, but Aflac research shows a pronounced age gap. In the company’s 2023 WorkForces Report, 68% of Gen Z employees reported moderate or high burnout, compared with 64% of millennials, 56% of Gen X employees, and 34% of baby boomers. Across all employees surveyed, the figure was 57%.
The generational divide remained visible in Aflac’s 2025 findings. Gen Z had the highest reported burnout rate at 74%, followed by millennials at 66%. Nearly three-quarters of employees overall, 72%, also reported moderate to very high workplace stress.
So why are younger employees reporting so much burnout? Research points to several overlapping pressures. Heavy workloads were the most commonly cited workplace stressor in 2025, named by 35% of employees, while workers of all ages also reported concerns about finances, personal responsibilities, and uncertainty about the future.
Financial pressure adds another layer to this for many Gen Z workers, who report high anxiety about covering unexpected costs on top of their already stretched schedules.
More than one in three U.S. adults aren’t getting enough sleep
Time off is only one measure of rest. Sleep provides another.
The CDC considers adults who report fewer than seven hours of sleep in an average 24-hour period to be getting insufficient sleep. In 2022, 37% of U.S. adults reported sleeping less than seven hours per night.
That national figure masks considerable variation by state. Reported rates of insufficient sleep were as high as 45.6%, with the list of most sleepless states led by Hawaii:
- Hawaii: 45.6%
- West Virginia: 41.3%
- Alabama: 40.5%
- Louisiana: 39.8%
- Kentucky: 39.3%
- Nevada: 38.9%
- Tennessee: 38.8%
- Arkansas: 38.7%
- Ohio: 38.5%
- New York: 38.4%
At the opposite end, states with the lowest reported rates of insufficient sleep include:
- Minnesota: 29.6%
- Vermont: 29.6%
- Colorado: 30.3%
- Nebraska: 30.6%
- Oregon: 30.9%
America’s Health Rankings bases these state estimates on 2022 CDC Behavioral Risk Factor Surveillance System data.
Making time for a break
Vacation days, burnout, and sleep aren’t the same thing, and these studies were conducted separately in different populations and years. Still, while the data can’t tell us that having less vacation causes burnout or that burnout causes insufficient sleep, what the numbers do show is that access to time off and adequate rest varies considerably, and too often, it isn’t enough.
Closing that gap doesn’t always require a plane ticket, a packed itinerary, or even a full day off. Sometimes, it just means making better use of the time already available.
That’s where ResortPass comes in. We offer day access to hotel pools and spas with no need for an overnight stay, turning a single free afternoon into an actual break. Browse hotel day passes or spa experiences to start planning your daycation.
Sources cited:
Aflac. (2023). 2023–2024 Aflac WorkForces Report: Stress and burnout [Infographic]. https://www.aflac.com/docs/awr/pdf/2023-trends-and-topics/2023-aflac-awr-stress-burnout-infographic.pdf
Aflac Incorporated. (2025, October 9). American workforce burnout reaches 7-year high [Press release]. https://newsroom.aflac.com/2025-10-09-American-workforce-burnout-reaches-6-year-high
Centers for Disease Control and Prevention. (2024, October 29). Health risk behaviors. PLACES: Local Data for Better Health. https://www.cdc.gov/places/measure-definitions/health-risk-behaviors.html
Expedia Group. (2024a, June 20). Expedia report finds Americans win the gold medal for taking fewest vacation days in the world [Press release]. https://www.expedia.com/newsroom/expedia-report-finds-americans-win-the-gold-medal-for-taking-fewest-vacation-days-globally/
Expedia Group. (2024b). Vacation deprivation report [Infographic]. https://www.expedia.com/newsroom/wp-content/uploads/2024/06/SG_Vacation-Deprivation-Infographics_FINAL.pdf
U.S. Bureau of Labor Statistics. (2025a). Paid leave benefits: Average number of sick and vacation days by length of service requirement [Chart]. https://www.bls.gov/charts/employee-benefits/paid-leave-sick-vacation-days-by-service-requirement.htm
U.S. Bureau of Labor Statistics. (2025b, September 25). Table 6. Selected paid leave benefits: Access, March 2025 (Employee Benefits Survey). https://www.bls.gov/news.release/ebs2.t06.htm
U.S. Department of Labor. (n.d.). Vacation leave. Retrieved September 16, 2026, from https://www.dol.gov/general/topic/workhours/vacation_leave
United Health Foundation. (n.d.). Insufficient sleep. America’s Health Rankings. Retrieved September 16, 2026, from https://www.americashealthrankings.org/explore/measures/sleep